We have some exciting news to share! The Motley Fool UK has now become The Twelfth Magpie -- an independent, UK-owned company, led by our long-serving UK management team — Mark Rogers, Chris Nials and Heather Adlington. In practical terms, it’s the same team you know, now fully focused on serving our UK readers and members.

Just as importantly, our approach remains unchanged: long-term, jargon-free, and on your side. This site is our new home, and there will be extra tweaks made across the coming few days as we settle in. So if anything looks a little off, please bear with us!

The content of this article was relevant at the time of publishing. Circumstances change continuously and caution should therefore be exercised when relying upon any content contained within this article.

Stock market crash: 5 lessons from previous meltdowns

After US stocks had their worst January since 2009, will this spill over into a global stock market crash? These five lessons from history might help…

You’re reading a free article with opinions that may differ from The Twelfth Magpie’s Premium Investing Services. Become a member today to get instant access to our top analyst recommendations, in-depth research, investing resources, and more. Learn more, and get a free 'Best Buy Now' stock!.

As I wrote yesterday, I’m increasingly concerned about the growing risks of a stock market crash. Indeed, after three years of strongly rising global share prices, such a setback wouldn’t come as any surprise to me. As asset prices inflate, markets become less stable, which usually leads to heightened volatility. That’s something we’ve definitely seen since the end of 2021, especially among US stocks. However, each stock market crash is unique, so here are five lessons to take away from previous UK bear (falling) markets.

1. Some stock market crashes last years

The broad-based FTSE All-Share index has been around since 1962. According to investment platform A J Bell, this UK index has undergone 11 bear markets in 59 years. Some of these lasted several years. For example, from 31 January 1969 to 27 May 1970, the FTSE All-Share lost 37% of its value in a 481-day bear market. Even worse, from 15 August 1972 to 6 January 1975, the index collapsed by 72.6% over 874 days. But the longest post-1962 bear market lasted 1,167 days from 31 December 1999 to 12 March 2003. During this time, the FTSE All-Share more than halved, losing 50.9% of its value. I remember this long, drawn-out stock market crash almost as though it were yesterday.

Should you buy Rolls Royce shares today?

Before you decide, please take a moment to review this report first. Despite ongoing uncertainties from US tariffs to global conflicts, Mark Rogers and his team believe many UK shares still trade at substantial discounts, offering savvy investors plenty of potential opportunities to learn about.

That’s why this could be an ideal time to secure this valuable research – Mark’s analysts have scoured the markets to reveal 5 of his favourite long-term ‘Buys’. Please, don’t make any big decisions before seeing them.

2. And some are over in months

Not all UK stock market crashes are multi-year meltdowns. Thankfully, some are mercifully brief. For instance, the bear market from 17 August to 28 September 1981 lasted just 42 days, when the index dropped by 21.5%. Likewise, the 63-day bear market of 6 June to 8 August 1975 left the index 20.8% lower. And most recently, the ‘2020 flash crash’ lasted 62 days from 17 January to 19 March, plunging 37.2% before rebounding. I expect you remember this latest, brief bear market?

3. Some stock market crashes are brutal

Here in the UK, we endured two terrible stock market crashes in this millennium. From 31 December 1999 to 12 March 2003, the FTSE All-Share index collapsed by 50.9% during the ‘dotcom bust’. During the global financial crisis, the index crashed by 48.6% from 25 June 2007 to 3 March 2009. But the big daddy of all UK bear markets lasted from 15 August 1972 to 6 January 1975. With the oil price quintupling and UK inflation (consumer prices) exploding, this index imploded, losing almost three-quarters (-72.6%) of its value. Yikes.

4. Share prices sometimes take years to recover

After stock market crashes, it usually takes prices longer to recover than they did to fall. On eight out of 10 occasions (excluding the 2020 crash), the FTSE All-Share took longer to make up lost ground than it did to lose it. The average market downturn lasted 385 days, versus an average of 648 days to recover from bear-market losses. The longest recovery lasted 1,529 days from 3 March 2009 to 10 May 2013. Nasty.

5. Shares eventually bounce back

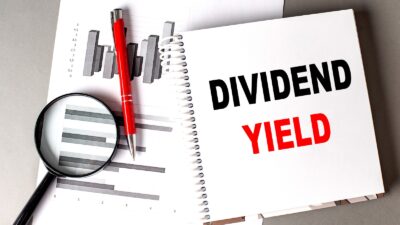
Based on the FTSE All-Share index, the average UK stock market crash since 1962 has lasted just over a year. Meanwhile, the average fall has been 36%. But on every occasion (including January 2020 to now), the index has eventually bounced back to reach higher highs. This tells me that buying quality stocks during bear markets tends to pay off handsomely in the long run. For example, in 2002, the UK stock market crashed by roughly a quarter. But by buying cheap, bombed-out shares, I almost tripled my money in that terrible year.

Finally, until I can see a good reason to stop, my family portfolio will keep buying cheap UK shares with high earnings yields and fat dividends!

Cliffdarcy has no position in any of the shares mentioned. The Motley Fool UK has recommended Morrisons and Ocado Group. Views expressed on the companies mentioned in this article are those of the writer and therefore may differ from the official recommendations we make in our subscription services, such as Share Advisor, Hidden Winners and Pro. Here at The Motley Fool, we believe that considering a diverse range of insights makes us better investors.

More on Investing Articles

Close-up of British bank notes
Investing Articles

As British American Tobacco shares dip, is this a hot buying opportunity?

Are British American Tobacco shares on their way to completing another decade of dividend growth? Let's check out this latest…

Read more »

DIVIDEND YIELD text written on a notebook with chart
Investing Articles

I’m targeting a yearly income of £6,898 from £20,000 in this FTSE heavyweight!

This FTSE dividend play looks far too cheap for the cash it throws off — and the mix of rising…

Read more »

Passive income text with pin graph chart on business table
Investing Articles

How much would I need to invest in this FTSE 100 dividend gem to aim for £14,754 a year in passive income?

Passive income is the goal for many investors, and this FTSE dividend star highlights the qualities that can turn long‑term…

Read more »

View over Old Man Of Storr, Isle Of Skye, Scotland
Investing Articles

How much do you need in a SIPP to earn a £667 monthly passive income?

Harvey Jones shows how investors could use the generous tax breaks available on a Self-Invested Personal Pension, or SIPP, to…

Read more »

Happy male couple looking at a laptop screen together
Investing Articles

Up 50% with a stunning 6.4% yield! How do Aviva shares do it?

Harvey Jones is hugely impressed by the recent performance of Aviva shares, and examines why the FTSE 100 insurer has…

Read more »

Satellite on planet background
Investing Articles

Down 19% to under £20! Is now exactly the right time for me to capitalise on BAE Systems’ bargain-basement share price?

BAE Systems’ share price has dropped sharply, but a far bigger long term demand cycle is only just beginning. Here’s…

Read more »

Person holding magnifying glass over important document, reading the small print
Investing Articles

Closing in on £33 and around an all‑time high, is this FTSE 250 favourite seriously mispriced?

With the shares pushing into record territory, I’ve revisited the underlying business, its growth outlook and the valuation picture investors…

Read more »

Close-up of British bank notes
Investing Articles

£20,000 invested in Barclays shares a year ago is now worth…

Barclays shares have quietly delivered a 41% return in just 12 months — and the long term numbers suggest the…

Read more »